Priya's Sunday experiment: one folder, one agent, and a question about what she was still paying for
Ten subscriptions you can cancel, downgrade, or stop renewing. One tool at a time. Starting this week.
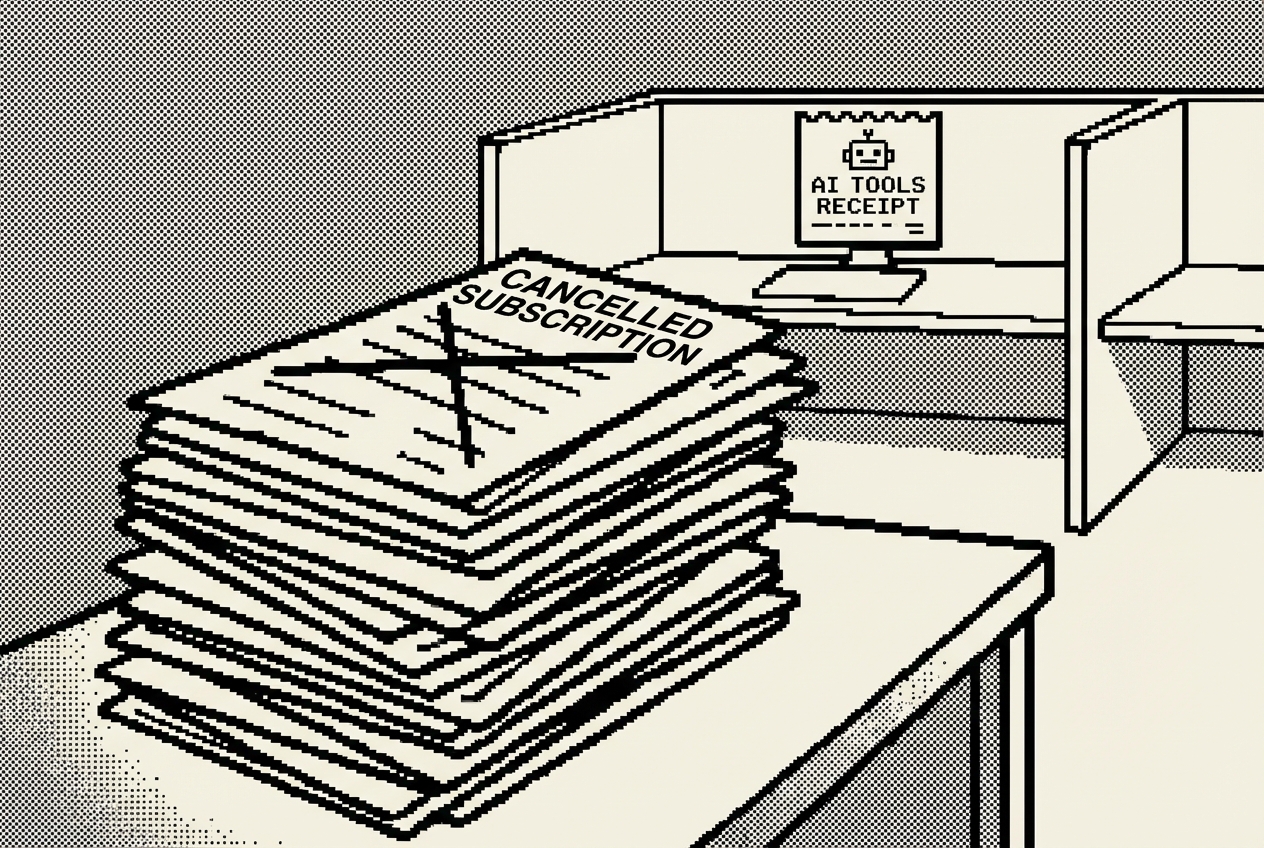
Priya stared at the number in the top-right corner of her screen: $36,800. That was the annual cost of her sales team's software stack, not counting the CRM itself. Pipeline analytics. Proposal generation. CPQ tools. Forecasting platforms. Client portals. Territory management. A constellation of subscriptions that her CFO questioned every quarter and her reps used at maybe 20% capacity.
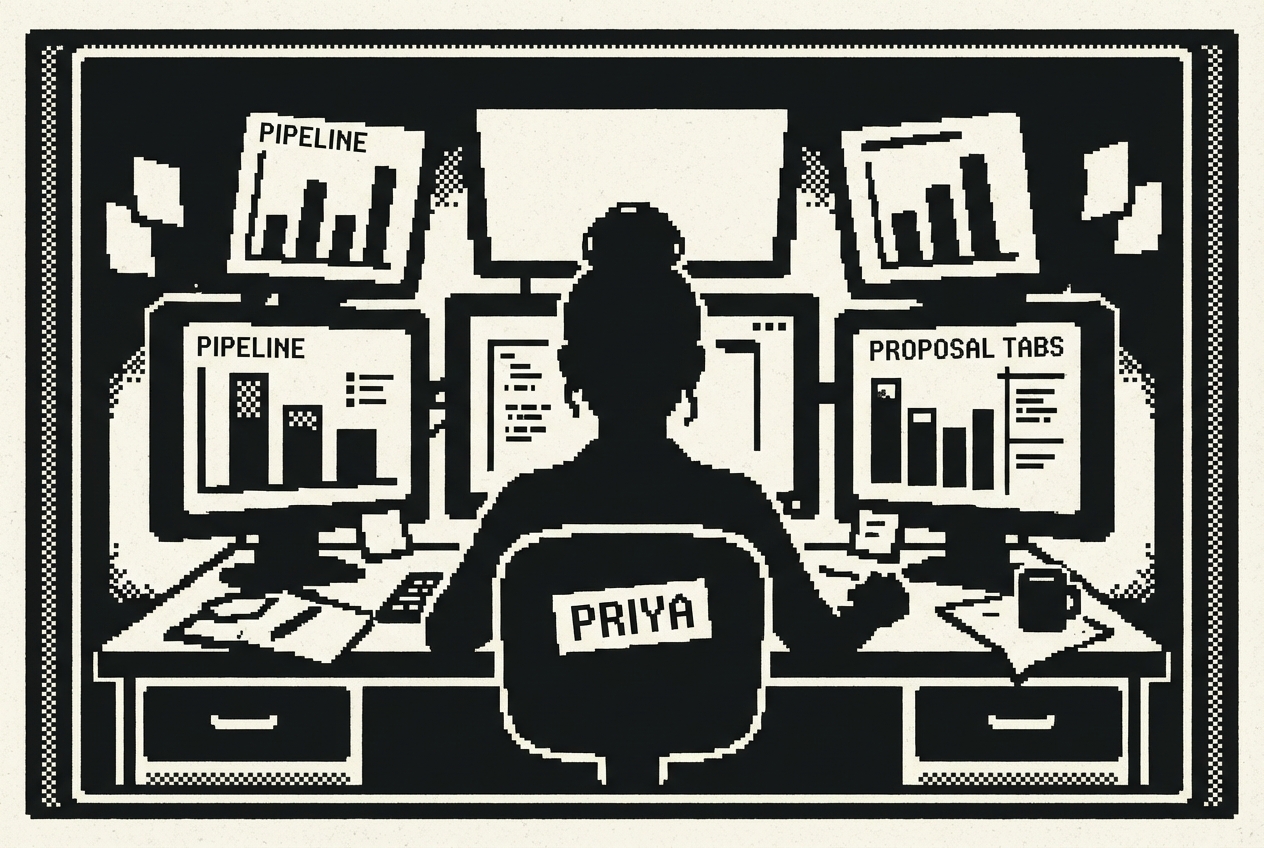
She'd just come out of a deal review where three reps presented pipeline updates using three different formats. One had pulled numbers from the CRM dashboard. Another had exported to a spreadsheet and built pivot tables. The third had screenshots from their pipeline analytics tool that were somehow two weeks old. Priya had spent the first fifteen minutes of the meeting reconciling the numbers before anyone could discuss strategy.
This was a 40-person SaaS company. Not a startup figuring things out. Not an enterprise drowning in process. A mid-market team that should have been closing deals, not wrestling with tools that were supposed to make closing easier.
The proposal software was the one that really got to her. They were paying $3,600 a year for a tool that most reps bypassed entirely. They'd copy the last proposal they sent, swap out the client name and numbers, and email it as a PDF. The software had templates, approval workflows, tracking analytics, and a library of content blocks. Her team used it as a glorified document converter.
Priya opened her laptop on a Sunday afternoon, not to catch up on deals, but to run an experiment. She'd heard about Claude Cowork from a friend in marketing who'd used it to automate content briefs. The idea was simple: point an AI agent at her files and see what it could actually build.
She created a folder called /sales/proposals/ and dropped in three things: a recent discovery call transcript, her company's pricing sheet, and the proposal template they'd been reusing for two years. Seven minutes later, she had a 12-page proposal that was better than anything her team had produced that quarter. Not because the writing was fancier, but because it actually referenced the client's specific challenges from the discovery call.
She spent the rest of that Sunday building four more things. A competitive battle card generator. A meeting prep system. An ROI calculator she could share with prospects as an interactive link. And a quote builder that matched their actual pricing tiers and discount rules.
Each build taught her something about the tools she'd been paying for. The proposal software wasn't bad. It was generic. Every subscription she paid for was a compromise between what her team needed and what the vendor decided to build.
By Monday morning, Priya had a question she hadn't expected: what exactly was she still paying for?
The next six weeks were methodical. Priya didn't cancel everything at once. She built replacements one at a time, tested them alongside the existing tools for a week, and only cancelled when she was confident the replacement worked for her team.
What follows is every tool she built, and every subscription she cancelled.
Proposal software promises to streamline the sales cycle. In practice, it introduces a new workflow that competes with the way your reps already work. They draft in Google Docs. They email PDFs. They copy and paste from the last deal that closed. The proposal tool sits in a browser tab they open when a manager asks if they're using it.
You're paying $3,600 a year for tools like PandaDoc, Proposify, or Qwilr. These are good products. They offer e-signatures, content libraries, analytics on when a prospect opens the document, and templates that enforce brand consistency. But if you're honest about actual usage, most of your team uses maybe two features: the template and the PDF export.
The real cost isn't just the subscription. It's the time your reps spend formatting instead of selling. A senior rep spending 90 minutes on proposal formatting is 90 minutes they're not spending on the next deal.

There's also the consistency problem. Priya noticed it during a quarterly review when she pulled up the last ten proposals her team had sent. They were all over the place. Some included ROI projections, others didn't. Two of them still had another client's industry jargon in the executive summary because the rep had copied from the wrong template.
The disconnect between what the tool offers and what the team uses creates a peculiar kind of waste. You're paying for intelligence features, open tracking, content analytics, engagement scoring, that generate data nobody reviews.
Then there's the bottleneck nobody talks about. When a hot deal needs a proposal fast, the rep who can format quickly gets it out in two hours. The rep who struggles with the tool takes four. Priya had watched at least three deals cool off because the proposal took too long to assemble.
Claude Cowork is an autonomous agent that works with your files. You give it folder access, tell it what to do, and it executes. For proposals, this is exactly the right tool.
Start by creating a proposal workspace. You need three inputs: your proposal template, your pricing documentation, and the specific deal context.
The template file is important. This isn't a generic document outline. It's your team's proposal structure, the one that reflects how your best reps write when they're at their best. Priya built hers with seven sections: Executive Summary, Client Situation, Proposed Solution, Implementation Timeline, Investment, Expected Outcomes, and Next Steps.
Cowork reads all the files, cross-references the information, and generates a proposal that's specific to this deal. Not a mail merge. Not a template with blanks filled in. A document that connects your product's capabilities to the prospect's actual stated problems.
What comes back is a complete proposal, typically eight to twelve pages. The Executive Summary opens with the prospect's specific challenges, phrased in their own language from the discovery call. The Client Situation section demonstrates that you listened. The Proposed Solution maps your product's features directly to their stated needs. The pricing section applies the correct tier based on the company size mentioned in the discovery notes.
Priya tested this with a side-by-side comparison. The PandaDoc proposal took the rep two hours and fifteen minutes. The Cowork proposal took Priya twelve minutes, including her review and edits. Both proposals were comparable in quality.
Want to batch them? Point Cowork at the entire /deals/ folder and tell it to generate proposals for every prospect that has discovery notes. Five proposals, all specific to their respective deals, all ready for rep review by Monday morning.
There's an unexpected consistency benefit too. Every Cowork-generated proposal follows the same structure, hits the same quality bar, and includes the same essential elements. New reps produce proposals that are indistinguishable in quality from veteran reps' work.
One practical tip: the quality of the discovery notes determines the quality of the proposal. "Had a good call, they seem interested" produces a generic proposal. "VP of Operations, 200 employees, currently using Competitor X, frustrated with reporting latency, budget approved for Q2" produces a proposal that reads like you've been studying their business for weeks.
PandaDoc, Proposify, or Qwilr, typically $3,600/yr for a team plan
Full cancellation of proposal software
Your CRM has a pipeline view. Every CRM does. But the pipeline view in your CRM is built for the CRM's idea of a sales process, not yours. You want to see conversion rates between your specific stages. You want to know which deals have been stuck for more than two weeks. You want a revenue forecast that weights deals by your historical close rates, not the generic probability the CRM assigns.
So someone on your team builds a spreadsheet. Then another person builds a different spreadsheet. Then you're paying $4,800 a year for a pipeline analytics add-on like InsightSquared or Clari's pipeline features to get the dashboards your CRM should have included in the first place.
Priya's Monday meetings were the evidence. She wanted to answer three questions: Which deals are most likely to close this month? Which deals have stalled and need intervention? Is the pipeline healthy enough to hit next quarter's target? Her CRM answered none of these directly.
The pipeline analytics tool also introduced its own version of reality. It had its own stage definitions, its own probability calculations, its own way of categorizing deal health. These didn't always align with how Priya's team talked about deals. The result was a team that maintained two mental models of the pipeline: the tool's version and their own.
OpenAI Codex App is a desktop command center for parallel AI agents. For a pipeline dashboard, you'll use it to build a custom web application that reads your CRM exports and shows exactly the metrics your team tracks.
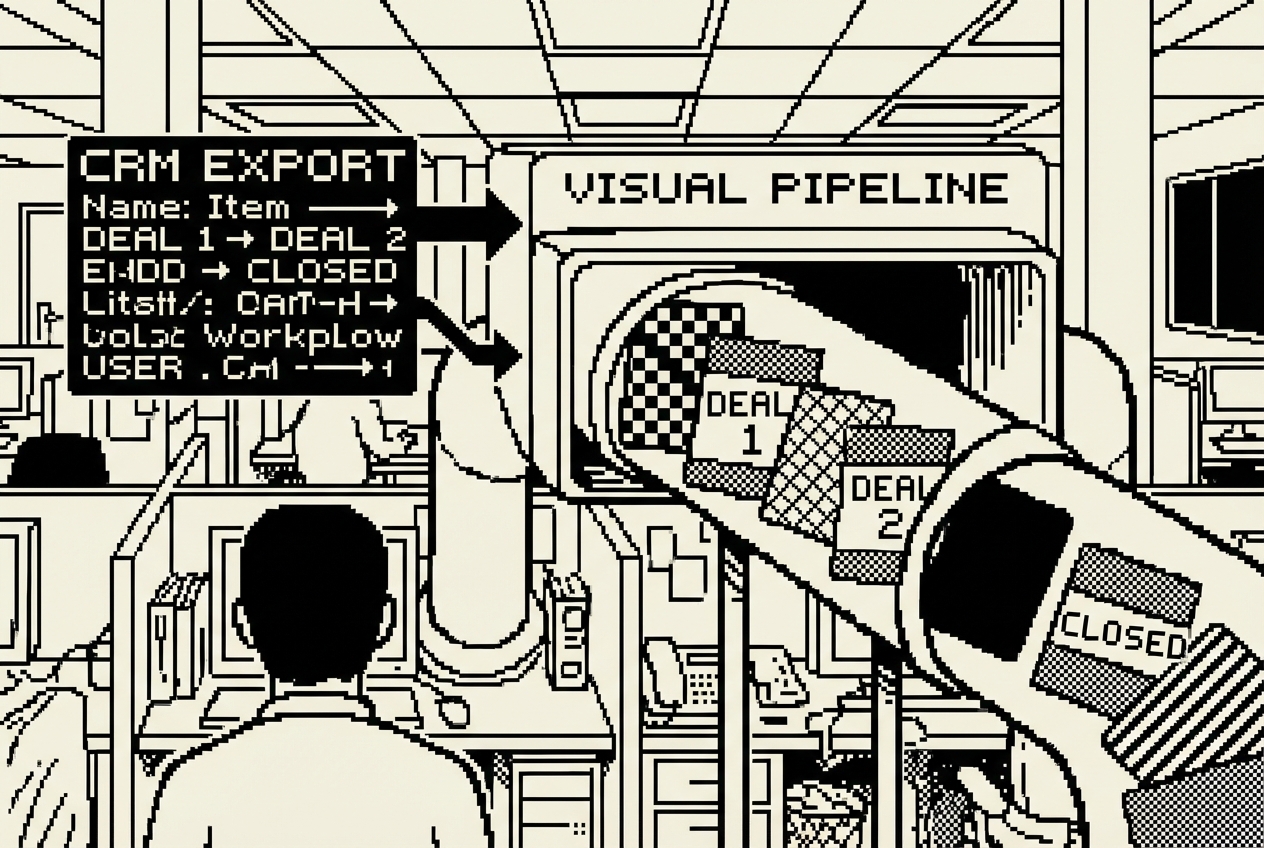
Start with a CSV export from your CRM. Every CRM lets you export deals with columns like deal name, stage, value, close date, owner, and last activity date.
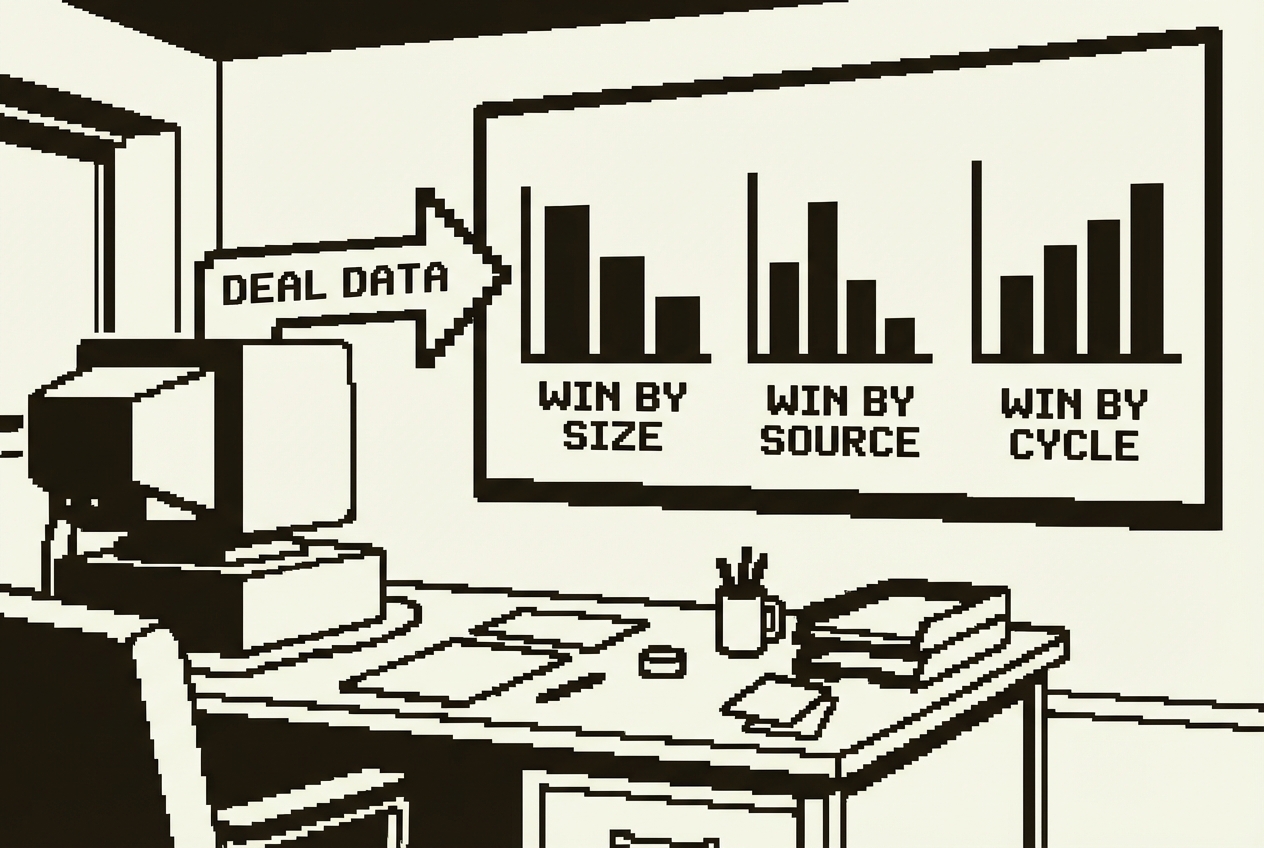
Codex dispatches agents. One handles the data processing logic. Another builds the user interface. Within minutes you have a working local application. The pipeline view shows your deals flowing through your stages with dollar values stacked at each phase. Deals are color-coded by age: green for healthy, yellow for aging, red for stuck.
The conversion rate chart reveals something immediately useful. Priya discovered that her team's "Demo Completed" to "Proposal Sent" conversion was only 58%, not the 75% the CRM's default probability suggested. That single insight changed how she staffed the demo-to-proposal handoff.
The stuck deals list is the feature Priya's team uses every Monday. It surfaced a $45,000 deal that had been sitting in "Negotiation" for nineteen days without any logged activity. The deal closed two weeks later after a quick call revealed the prospect had unanswered questions about implementation timeline.
The forecast section applies your actual conversion rates to the current pipeline. When Priya showed the first forecast to her VP of Sales, his reaction was telling: "This is the first pipeline number I've believed in two quarters."
For team access, push the project to GitHub and deploy it on Railway. Your team gets a URL they can bookmark. Update the data weekly by uploading new exports.
One detail worth noting: the dashboard can evolve. After two weeks of use, Priya's team asked for a "deals by lead source" view. She opened Codex, described the addition, and the feature was live within minutes.
InsightSquared or Clari pipeline analytics, typically $4,800/yr
Full cancellation of pipeline analytics platform
Somewhere in your sales process, a prospect asks the question every sales team dreads and loves simultaneously: "What's the ROI?"
You love it because it means they're thinking about buying. You dread it because your answer is a spreadsheet someone on the team built two years ago that requires manual input and looks like it was designed in 1997. Or you're paying $1,200 a year for a tool like Outgrow that lets you build interactive calculators, but the customization options are limited and the branding feels off.
The gap between what you want the calculator to do and what the tool lets you do is where the frustration lives. Outgrow gives you templates with pre-built logic. But your ROI story is specific to your product, your pricing model, and the way your customers measure value.
Priya's team had tried three approaches over two years. A spreadsheet that was accurate but ugly. A custom calculator built by a freelance developer at $4,500 that was outdated within six months. And Outgrow, which was the right concept but too rigid in practice.
The prospect doesn't just want an ROI number. They want to believe the number. That belief comes from specificity: seeing their own inputs flow through logic that feels tailored to their situation.
Claude Artifacts are interactive tools built inside a conversation. You describe what you want, and Claude builds a working calculator you can use immediately and share via link. No code required. No deployment.
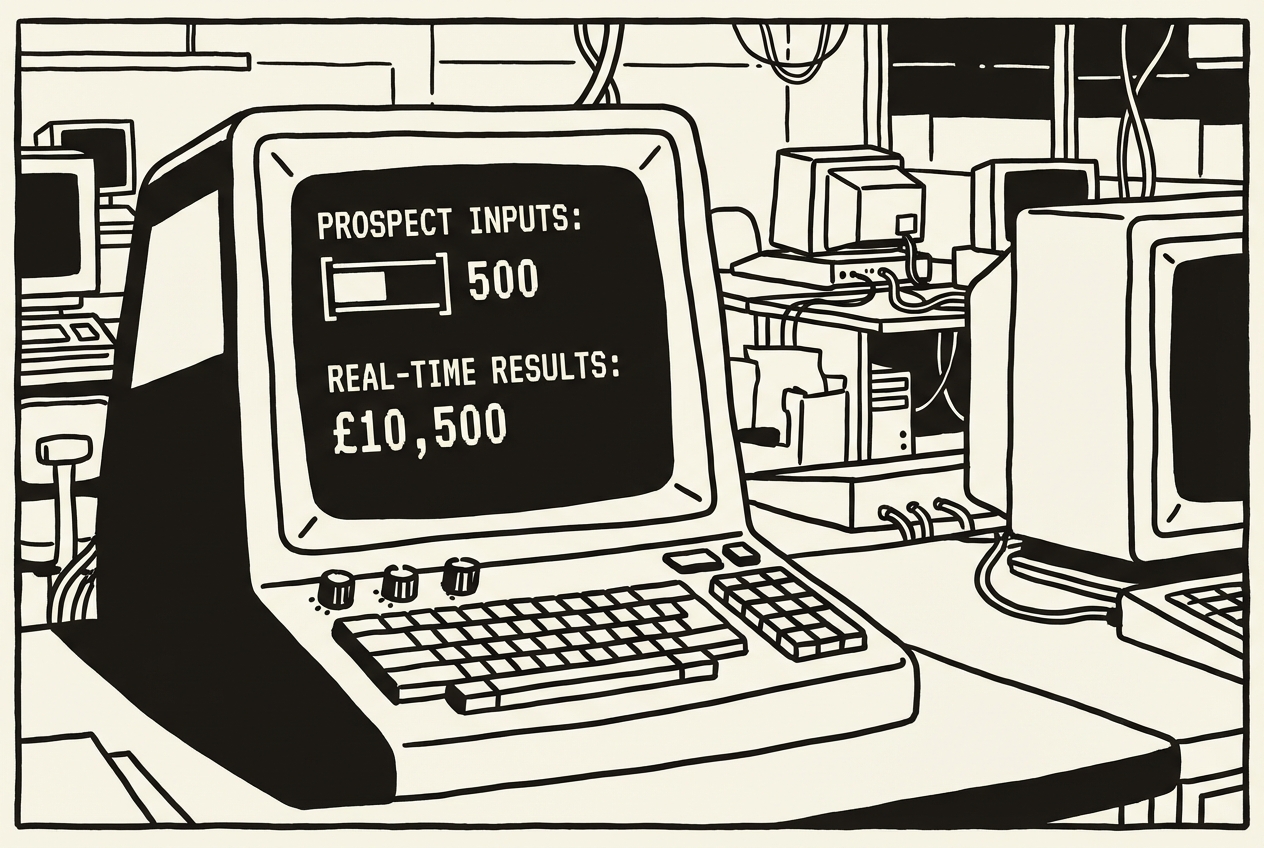
Claude generates the Artifact right in the conversation. You can test it immediately. The calculator appears as a working interactive tool: input fields on the left, results on the right, a bar chart comparing current state to future state. The math updates in real time as the prospect adjusts their inputs.
Priya tested the first version and caught two things she wanted to change. The savings formula needed to account for the ramp-up period in the first quarter. And the payback period calculation should factor in implementation costs. She told Claude the adjustments, and the new version had a more honest ROI story, one that acknowledged the ramp-up period. Prospects trusted the number more when the calculator showed that payback takes eight months instead of four.
The usage pattern surprised Priya. Prospects didn't just use the calculator once. Champions were sharing the link internally, with their CFO plugging in numbers, their ops lead testing different team sizes. The calculator became a self-service sales tool that worked while her reps slept.
The maintenance burden is effectively zero. When pricing changes, you have a conversation with Claude and generate a new calculator. There's nothing to maintain between updates.
Outgrow or custom calculator subscriptions, typically $1,200/yr
Full cancellation of ROI calculator tool
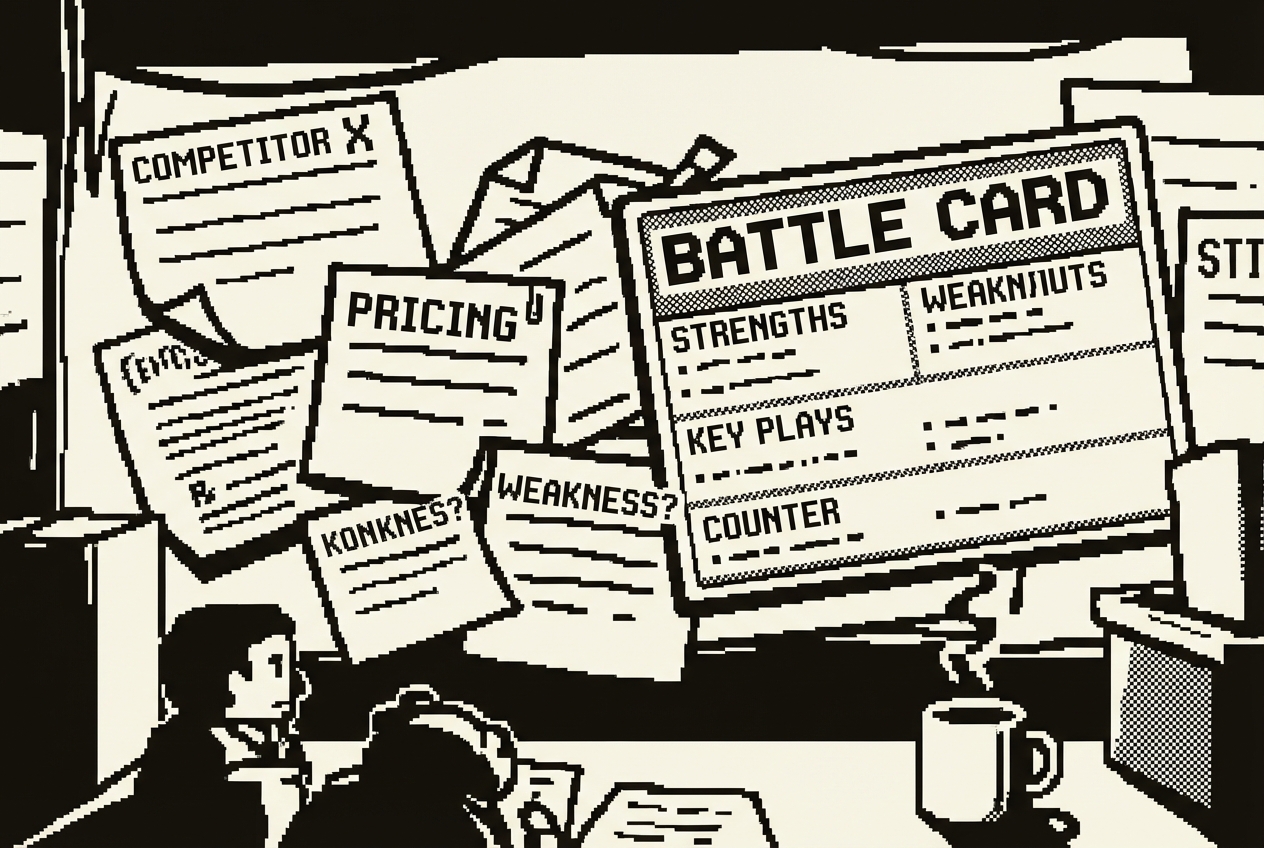
Competitive battle cards are the sales enablement content that matters most and ages the fastest. Your competitor releases a new feature on Tuesday. Your battle card still says they don't have that capability. Your rep walks into a call on Thursday and gets blindsided.
You're paying $2,400 a year (often as part of a larger package) for sales enablement platforms like Highspot or Seismic that include content management features. The promise is a central library where marketing publishes battle cards and sales always has the latest version. The reality is that marketing updates battle cards quarterly if you're lucky.
The problem isn't the platform. It's the update cycle. Battle cards need to be living documents, refreshed whenever competitive intelligence changes. But the people who write them (product marketing) are busy writing other things, and the people who need them (sales reps) don't have time to write.
There's a subtler problem too. The battle cards that product marketing produces are often accurate but unhelpful. They list features and checkmarks in comparison tables. What your rep needs in the middle of a call is not a feature comparison. They need a response to "Your competitor told us they can do X better than you." That response requires context from the field, from reps who've won and lost against each competitor.
Priya audited her team's battle cards and found that five of the eight were at least four months old. Two referenced competitor pricing that had changed. One described a competitor integration that had been deprecated. She traced two lost deals directly to outdated competitive information.
Cowork solves this by reading your existing competitive intelligence and generating updated battle cards on demand. The key is maintaining a research folder that your team contributes to informally.
The research notes file is where anyone on the team drops information. No formatting required. Just raw intelligence. The win-loss notes file is the secret weapon. After every competitive deal, won or lost, the rep writes three to five bullet points: what the competitor's pitch focused on, what objections the prospect raised, what ultimately swayed the decision. This takes two minutes after a deal closes.
Cowork synthesizes all the scattered notes into a structured, usable battle card. The output isn't a feature comparison table. It's a sales weapon: here's what they'll say, here's what's true, here's what's not, here's how we've beaten them before.
Priya ran the first batch on a Monday morning, generating battle cards for all five primary competitors. Each one was ready in about three minutes. Her most experienced rep said: "This is better than anything I've written because it includes context from deals I wasn't part of."
The output quality depends on the source material's richness. By the third month, after the team had accumulated win-loss observations from twenty competitive deals, the talk tracks were specific and battle-tested.
The feedback loop matters. When a rep uses a talk track and it works, they add a note. When it doesn't, they note what they said instead. The next battle card generation incorporates this field intelligence automatically. The cards get better over time.
Highspot or Seismic content features (partial), typically $2,400/yr for content management
Cancellation of sales enablement content management subscription
Every sales methodology tells you to prepare for meetings. Research the company. Understand the contact's role. Know their recent news, funding rounds, tech stack, and competitive landscape. Great advice. Terrible time math.
A thorough meeting prep takes 30 to 60 minutes. If your reps have four external meetings a day, that's two to four hours of research. Some reps do it. Most wing it. The ones who wing it close at lower rates, but the ones who prep everything lose half their selling day.
You're paying $3,600 a year for tools like LinkedIn Sales Navigator premium or Gong's prep features that promise to automate this. They surface some useful data, but they rarely give you a structured brief that's actually useful in the meeting.
Sales Navigator gives you the raw ingredients of a good prep. But it doesn't cook the meal. It shows you twelve data points and expects you to synthesize them into a meeting strategy in your head while you're driving to the parking lot.
The meeting prep problem isn't a knowledge problem. Your reps know they should prepare. It's a time allocation problem. The only way to change this calculation is to make prep faster than the decision to skip it.
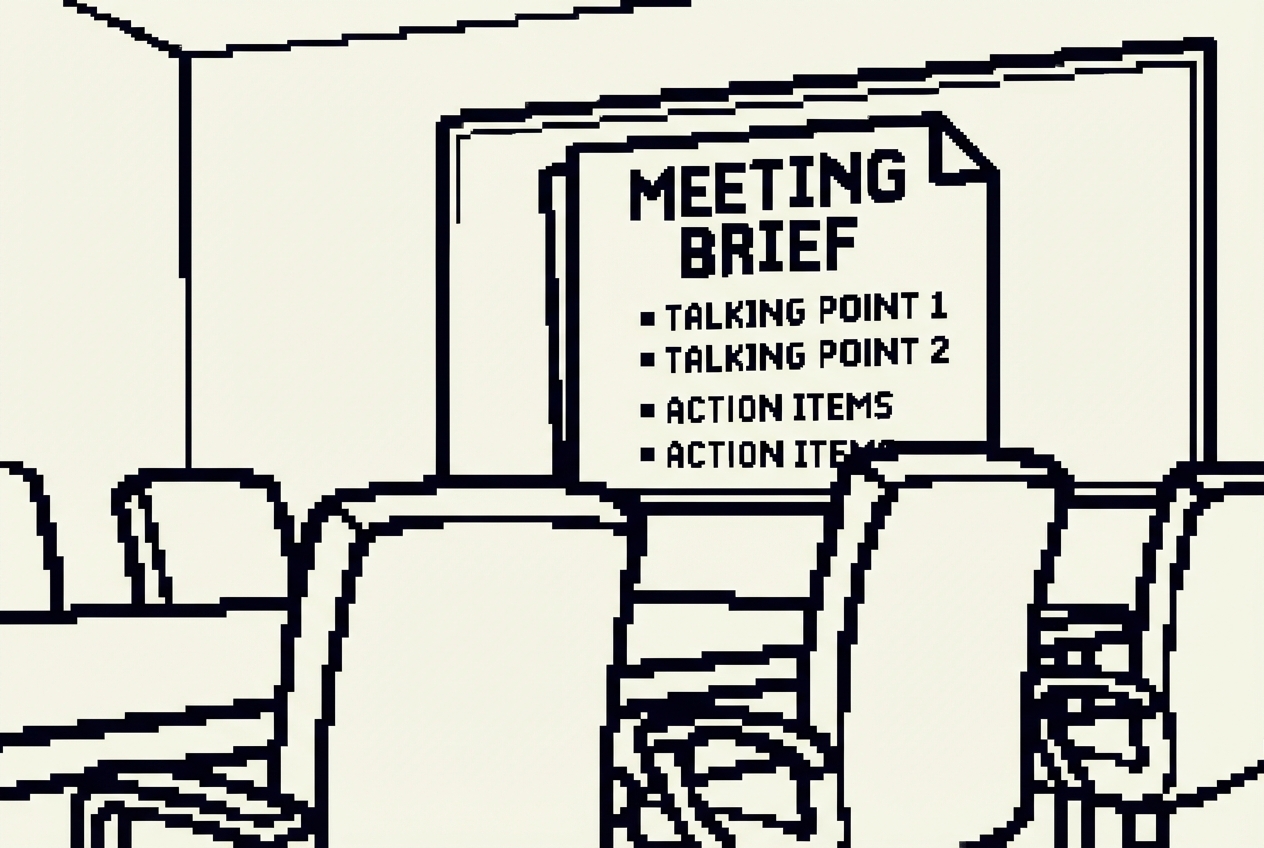
Google AI Studio is a free browser-based platform that builds apps from descriptions. You'll use Build mode to create a meeting prep tool that structures research into a one-page brief your reps can scan in two minutes.
AI Studio builds this as a working web app. Your rep opens it, types in "Acme Corp, Sarah Chen, VP of Engineering," pastes their CRM notes, and gets a structured brief in seconds. The company overview pulls from what the AI knows. The talking points are tailored to the contact's role. The objections are specific to selling to engineering leaders.
The brief is designed to be scanned in under two minutes. Bold headers, bullet points, no paragraphs. A rep glances at it in the elevator, walking into the meeting with context they'd have needed thirty minutes to assemble manually.
Priya tested this with a split experiment. For two weeks, half the team used the prep tool before every external meeting. The group using the prep tool converted at 34%, compared to 26% for the control group.
One pattern Priya noticed after a month: her reps started asking better questions in discovery calls. Not because the tool told them what to ask, but because the structured brief made them think about the prospect's situation before the call started.
LinkedIn Sales Navigator premium features or Gong prep capabilities, typically $3,600/yr
Downgrade to free LinkedIn tier, keep basic functionality
Configure-Price-Quote software exists on a spectrum. At one end, you have enterprise CPQ platforms that cost six figures and require a dedicated admin. At the other end, you have basic quoting features bolted onto proposal tools. In the middle, where most sales teams actually live, you have tools costing $2,400 a year that do about 30% of what you need and 70% of what you don't.
Your quoting process probably looks like this: rep selects products from a price list, applies any volume discounts manually, checks if the total needs manager approval, formats it into something presentable, and emails it. Half of that is math. Half is formatting. The tool you're paying for mostly handles the formatting.
The friction shows up in the details. A rep wants to offer a 15% discount on a three-year deal. The quoting tool's discount rules don't match your actual approval thresholds. So they override the tool, calculate the discount in their head or a spreadsheet, and paste the number back in.
Priya watched a new rep try to generate a quote during their second week. The rep spent twenty minutes figuring out how to apply a multi-year discount in the CPQ tool, gave up, opened a spreadsheet, did the math in thirty seconds, and typed the numbers into the tool's override field. The new rep asked Priya why they used the tool. Priya didn't have a great answer.
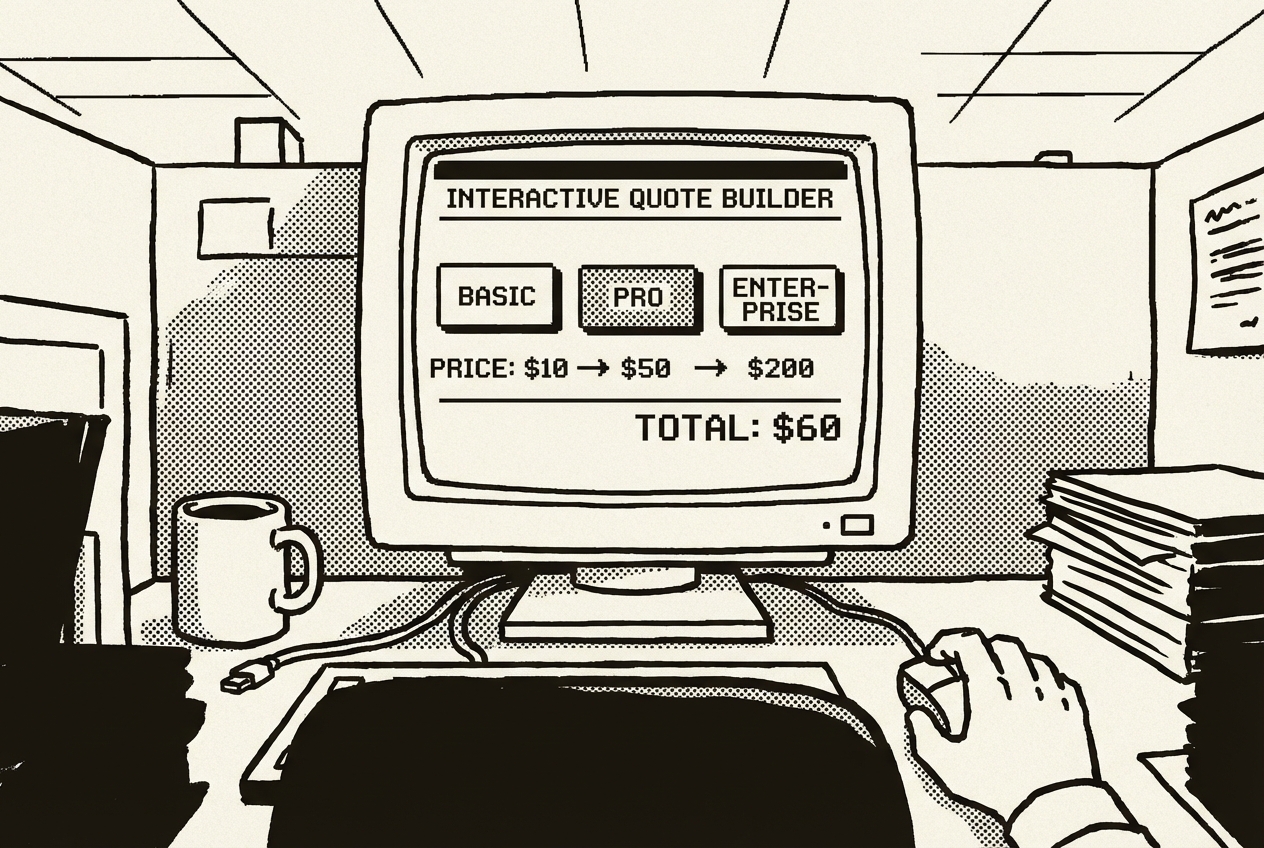
Claude Artifacts can build an interactive quoting tool that matches your actual pricing logic, not a generic CPQ workflow. Because you're describing your specific rules, the tool works exactly the way your team sells.
Claude builds this as an interactive Artifact. What you get back is a working quoting tool with dropdown menus for tier selection, checkboxes for add-ons, a slider for seat count, and a commitment length selector. As the rep makes selections, the pricing updates instantly.
The approval flag is the detail that makes this genuinely useful. When the total annual value crosses your threshold, a clear visual indicator appears: "VP Approval Required." The flag appears instantly as the rep adjusts the inputs, so they can see in real time how adding another seat pushes the deal past the approval threshold.
The new rep who spent twenty minutes wrestling with the CPQ tool? They generated their first quote with the Artifact in under two minutes on their second day. No training session needed.
Priya's team generates between 30 and 40 quotes per month. At roughly fifteen minutes saved per quote, that's seven to ten hours per month returned to selling.
There's a workflow integration that emerged naturally. The quote builder's output pastes directly into the proposal generated by Cowork (Use Case 1). Two tools that don't formally integrate but work together because they both produce clean, structured text.
PandaDoc quoting features or basic CPQ tools like DealHub Lite, typically $2,400/yr
Full cancellation of CPQ tool
Client portals are the sales tool that everyone wants and nobody wants to pay for. The idea is simple: give your clients a branded space where they can see their project status, access documents, review invoices, and track deliverables. The execution is expensive.
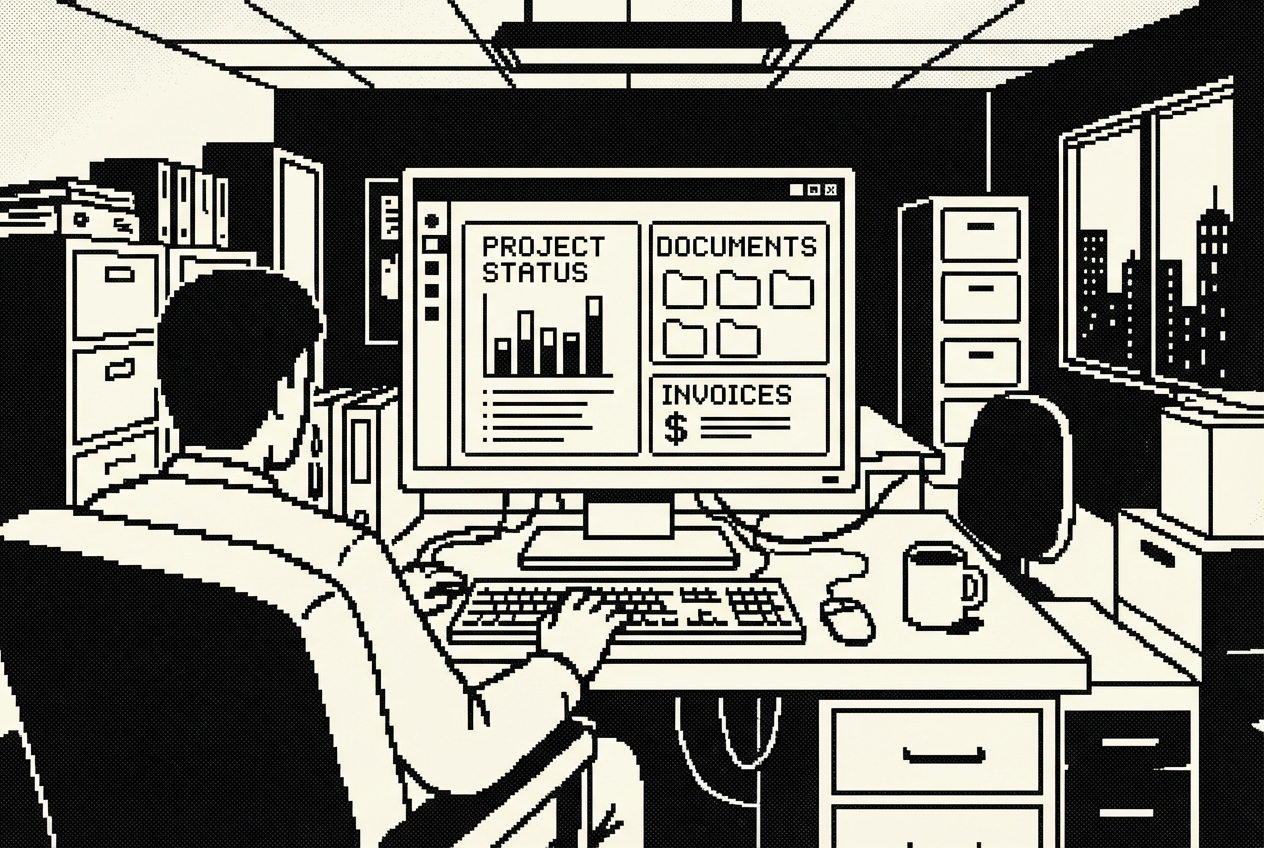
Dedicated client portal software like Accelo or custom portal subscriptions run $6,000 a year or more, and that's before customization. They come with user management, permission systems, notification engines, and integration marketplaces. You use approximately three features: a status page, a document library, and a way for clients to see their invoices.
The client experience without a portal is familiar. The client sends an email asking for the latest report. Your account manager replies with a Google Drive link, but the permissions are set wrong. A follow-up email fixes the permissions, but now the client sees every file in the folder, including internal notes. Three emails and forty-five minutes for what should have been a ten-second interaction.
Priya calculated the indirect cost during a particularly hectic quarter. Her account management team spent an estimated 25 hours per month responding to client requests for information that should have been self-serve. At a blended cost of $45/hour, that's $1,125 per month in labor, or $13,500 per year.
There's a relationship cost too. When a client has to email you to get information that should be accessible, they're reminded of the friction in the relationship. Every "what's the status?" email is a micro-moment where the client experiences your company as unorganized.
This is a Codex App and Railway combination. Codex builds the application. Railway hosts it.
Codex builds the full application with both client-facing and admin-facing views. Multiple agents work in parallel: one building authentication, another constructing the client dashboard, another setting up the admin panel.
Priya started with her five largest accounts, migrating their documents and setting up their logins over a single afternoon. Within two weeks, the five pilot clients had stopped emailing for status updates entirely. They checked the portal instead.
The account management team's workflow changed in a way Priya hadn't predicted. Before the portal, account managers spent their client-facing time answering logistical questions. After the portal absorbed those questions, conversations shifted to strategic topics: expansion opportunities, implementation feedback, next-quarter planning.
The ongoing cost is Railway's hobby plan at roughly $5 a month. Your clients get a professional portal experience. Your team stops emailing status updates.
The cost comparison is stark. The enterprise portal: $6,000 per year, six weeks to configure. The custom portal: $60 per year in hosting, one afternoon to build.
Accelo or custom client portal subscriptions, typically $6,000/yr
Full cancellation, minus ~$60/yr for Railway hosting = $5,940/yr net
Revenue intelligence platforms promise to decode your sales conversations and surface patterns in your wins and losses. Gong, Chorus.ai, and their competitors record calls, transcribe meetings, and use AI to analyze what separates closed-won from closed-lost. These tools are powerful. They're also $5,000 a year or more for the analytics features, often bundled into packages you can't unbundle.
Most sales teams use revenue intelligence for two things: call recording (which is valuable and we're not replacing) and pattern analysis (which you use quarterly at best). The quarterly win/loss review meeting is where someone pulls up the analytics dashboard, shows aggregate data, and the team nods knowingly before going back to doing exactly what they were doing before.
What Priya actually wanted from win/loss analysis was different from what the platform provided. She wanted to know: which deal characteristics predict a win at her company? Why do deals in the $25K-$50K range close at a higher rate than deals above $75K? When her team loses to a specific competitor, what's the pattern?
The quarterly review problem is structural. By the time the analytics are assembled and discussed, the quarter is over and new deals have already been won and lost without the benefit of the analysis.
Claude Code is a terminal-based AI coding agent. For win/loss analysis, it builds a tool that processes your deal data and generates reports that surface real patterns.
Claude Code reads the CSV, runs the analysis, and generates an HTML report you can open in any browser. The report opens with an executive summary highlighting the most important findings. Each section dives into one dimension of your win/loss data with visualizations and commentary.
Priya's first report showed a win rate decline from 38% to 31% over six months, a trend she'd felt but hadn't quantified. The sales cycle comparison showed that won deals averaged 34 days while lost deals averaged 52 days.
The deal size analysis showed that Priya's team crushed it in the $10K-$50K range (44% win rate) but struggled above $75K (22% win rate). This led her to implement a qualification gate for deals above $50K. Within two quarters, the win rate on large deals climbed from 22% to 29%.
The report also surfaced a pattern nobody had noticed: deals that involved a proof-of-concept stage closed at 52%, while deals that went straight from demo to proposal closed at 31%. Priya adjusted the sales process to encourage POCs for mid-market deals.
The lead source analysis showed that deals from webinars closed at 41%, while outbound deals closed at only 19%. Dramatic enough to shift marketing budget allocation.
Priya runs the analysis monthly now. The reports take five minutes to generate and thirty minutes to review. The monthly cadence means the feedback loop is four times faster than the quarterly cycle.
Gong analytics or Chorus.ai analysis features (partial, keeping call recording), typically $5,000/yr
Cancellation of analytics tier, keep call recording and transcription
Territory management is one of those problems that feels like it should be simple and never is. You have accounts. You have reps. You need to distribute accounts so that workloads are balanced, geography makes sense, and revenue potential is roughly even across the team.
Enterprise tools like Xactly's territory features or Anaplan cost $3,000 or more annually for territory planning modules. They offer sophisticated optimization algorithms, constraint modeling, and what-if scenario planning. They're built for organizations with hundreds of reps and thousands of accounts. If you have a 10-person sales team covering three regions, you're paying enterprise prices for a problem you could solve on a whiteboard, if the whiteboard could do math.
The real pain isn't the territory plan itself. It's the conversations the plan needs to support. Every quarter, Priya sits in a room discussing territory changes. Someone proposes splitting a territory because one rep is overloaded. Someone else wants to reassign a cluster of accounts. A third person asks what happens if they hire two more reps next quarter. These are "what-if" questions that require rebalancing math that no one can do on the fly. So the meeting ends with "let's take this offline."
Priya's territory planning process had evolved into an annual ritual of dread. The planning itself took two days. The execution, actually reassigning accounts in the CRM and communicating changes to reps, took another day. Five total days of work that happened once a year and was outdated within a month.
Google AI Studio in Build mode creates a visual territory planning tool that you can update as your team changes. It's more flexible than a spreadsheet and costs nothing.
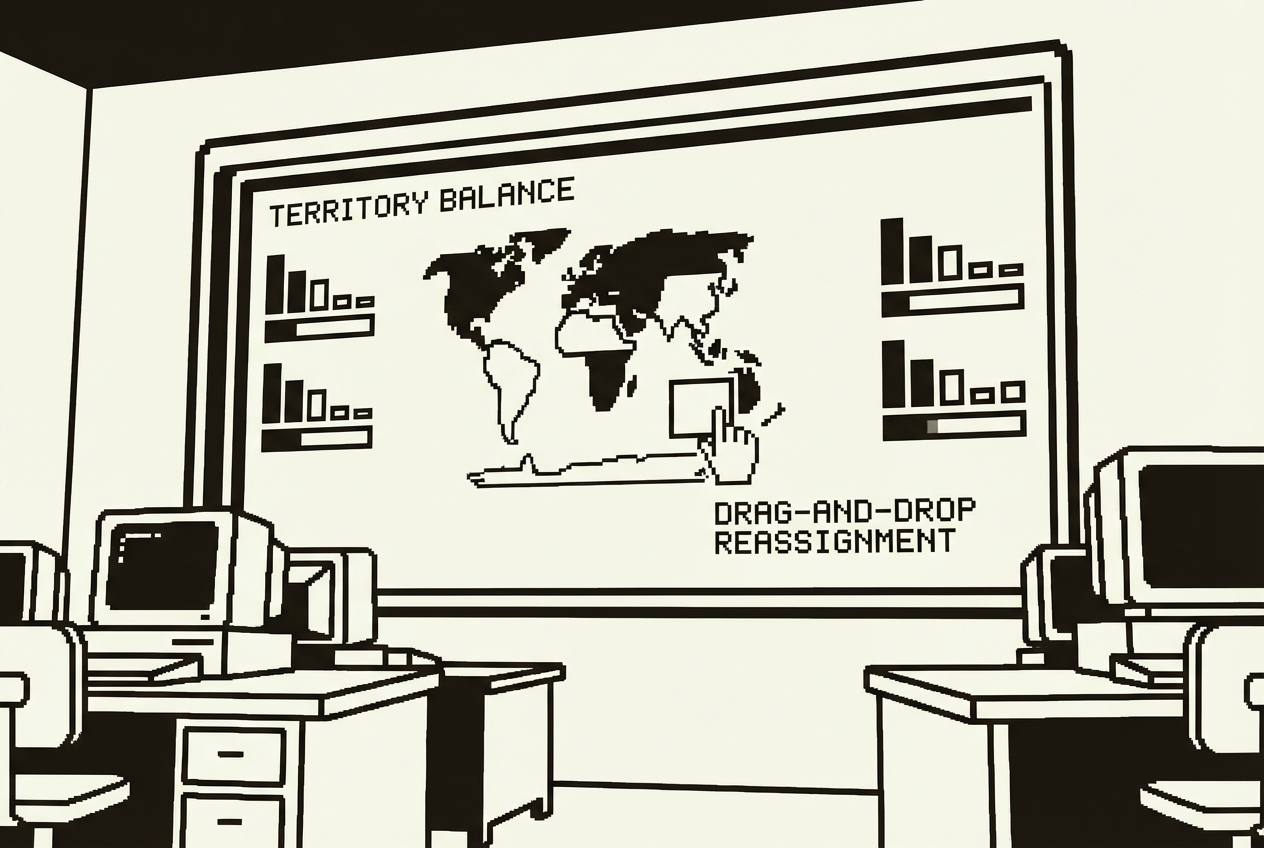
AI Studio builds this as a working application. The balance indicator is the first thing Priya looked at. A horizontal bar for each rep showing their total revenue potential relative to the team average. One rep was carrying $2.3 million in pipeline potential while another had $890,000. Seeing the bars side by side turned a vague sense of "the territories aren't even" into a specific, quantified problem.
Move an account from one rep to another and watch the balance metrics update instantly. Territory planning becomes a conversation instead of a homework assignment.
The what-if feature is where this gets genuinely useful. "What happens if we hire a rep for the Midwest?" Drag accounts over, see the impact. "What if we lose our top performer in the Northeast?" Redistribute their accounts, see which reps get overloaded. Her VP could see that adding one rep in the West would actually overload the Southeast rep, because several accounts were being cross-covered.
One unexpected benefit: the tool made territory conversations more objective. The balance indicator, showing revenue potential per rep with hard numbers, depoliticized the conversation.
The tool replaced a $3,000 annual subscription with a free application. But the real replacement wasn't the tool. It was the process. Territory planning went from a dreaded annual ritual to an ongoing conversation. Changes are incremental, data-driven, and visible to everyone.
Xactly territory features or Anaplan territory modules, typically $3,000/yr
Full cancellation of territory management module
Sales forecasting is where optimism goes to die. Your reps say deals will close this quarter. Your pipeline report suggests a number. Your gut says something different. The board wants a forecast you can defend, and the tool you're using to generate it is either your CRM's built-in forecast or a dedicated platform like Clari or Aviso that costs $4,800 a year.
The problem with generic forecasting is that it doesn't know your business. A 60% probability at the "Proposal Sent" stage is not the same at every company. Your historical data shows that proposals sent to enterprise accounts close at 45%, while proposals to mid-market close at 72%. Your forecasting tool doesn't know that.
The forecast credibility problem cascades upward. Your reps commit numbers based on gut feel and optimism. You adjust their commits based on your experience and skepticism. Your VP adjusts your adjustment. By the time the number reaches the board, it's been filtered through three layers of human intuition, none of which is grounded in statistical analysis.
Priya experienced this firsthand during a board meeting where the CEO asked: "How confident are you in the $1.2 million forecast for this quarter?" Priya's honest answer was "moderately," which is not an answer a board accepts. She couldn't point to a methodology. She couldn't explain the confidence range.
The forecasting tool also created a perverse incentive. Because the platform's deal scores influenced the aggregate forecast, reps learned to game the inputs. They'd log quick activities to boost deal scores. The forecast became a reflection of rep behavior within the tool, not a reflection of actual deal health.
This is a Claude Code and Railway combination. Claude Code builds the forecasting model. Railway hosts it so your leadership team can check the forecast without asking you.
Start with two CSV exports: your current open pipeline and your historical closed deals (at least 12 months of data).
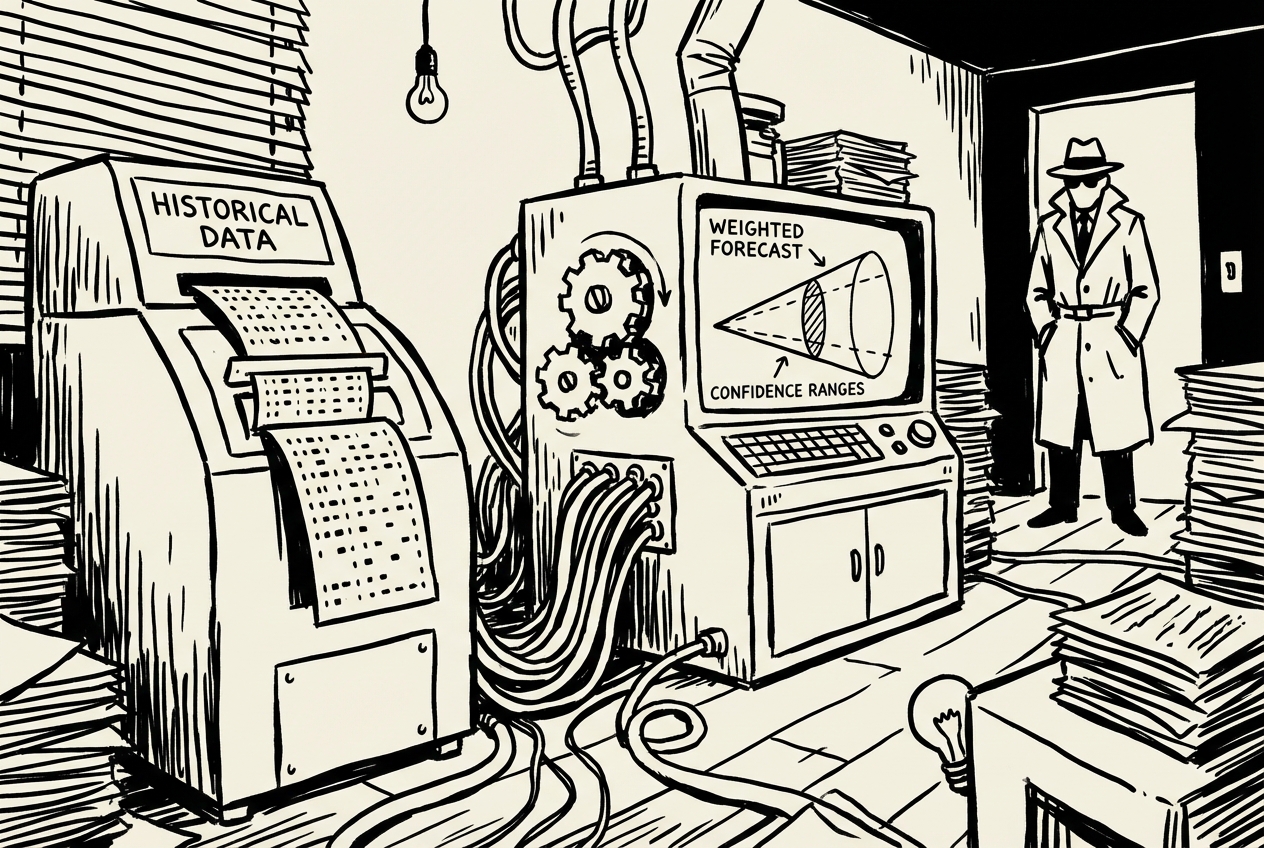
Claude Code analyzes your historical data first, building a conversion model specific to your business. It finds that your "Demo Completed" stage converts at 55% overall, but 68% for deals under $25K and 41% for deals over $100K. It discovers that referral deals convert at 2.1x the rate of outbound deals. These granular rates get applied to your current pipeline.
The headline forecast comes with a confidence range. Priya's first forecast showed: Expected $1.15M, Best Case $1.38M, Worst Case $890K. When the CEO asked how confident she was, she could now say: "Our model, based on twelve months of our actual close data, predicts between $890K and $1.38M with an expected outcome of $1.15M."
The quarterly comparison view shows pipeline health metrics across quarters: total pipeline value, weighted pipeline, number of deals, average deal size, and pipeline coverage ratio. A declining coverage ratio, even with a healthy absolute pipeline, signals trouble two quarters out.
The per-rep breakdown reveals something the aggregate number hides. A rep whose weighted pipeline is significantly below their quota needs attention now, not at the end of the quarter.
Update it by dropping in fresh CSV exports. Priya's third-quarter forecast was within 4% of the actual outcome. The CRM's default forecast was off by 18%.
The confidence range proved to be the most politically valuable feature. "We expect $1.15M but the range is $890K to $1.38M" invites a strategic discussion. "We'll hit $1.15M" invites judgment when the number comes in at $1.05M.
Clari, Aviso, or dedicated forecasting platforms, typically $4,800/yr
Full cancellation, minus ~$60/yr for Railway hosting = $4,740/yr net
Every number below matches the individual use case breakdowns above. Priya's sales stack went from a constellation of point solutions to the tools that actually needed to exist.
| Use Case | Tool Replaced | Action | Savings |
|---|---|---|---|
| 1. The Proposal Machine | PandaDoc / Proposify / Qwilr | Cancelled | $3,600 |
| 2. Pipeline Dashboard | InsightSquared / Clari pipeline | Cancelled | $4,800 |
| 3. ROI Calculator | Outgrow / custom calculators | Cancelled | $1,200 |
| 4. Battle Cards | Highspot / Seismic (partial) | Cancelled | $2,400 |
| 5. Meeting Prep | Sales Nav premium / Gong prep | Downgraded | $3,600 |
| 6. Quote Builder | PandaDoc quoting / DealHub Lite | Cancelled | $2,400 |
| 7. Client Portal | Accelo / custom portals | Cancelled | $6,000 |
| 8. Win/Loss Analysis | Gong analytics / Chorus.ai (partial) | Cancelled | $5,000 |
| 9. Territory Planning | Xactly / Anaplan territory | Cancelled | $3,000 |
| 10. Forecast Model | Clari / Aviso | Cancelled | $4,800 |
| Gross Sales SaaS Savings | $36,800/yr | ||
The AI tools used in this chapter are shared across departments. If your marketing team is already paying for Claude Max, the incremental cost to sales is $0 for those tools. The numbers below represent the full cost if sales were the only department using them.
| Tool | Monthly Cost | Notes | Annual |
|---|---|---|---|
| Claude Max (Cowork + Code + Artifacts) | $200/mo | Covers Use Cases 1, 3, 4, 6, 8 | $2,400 |
| ChatGPT Plus (Codex App) | $20/mo | Covers Use Cases 2, 7 | $240 |
| Google AI Studio | Free | Covers Use Cases 5, 9 | $0 |
| Railway hosting | ~$5/mo | Covers Use Cases 2, 7, 10 | $60 |
| Total AI Tool Costs | $2,700/yr | ||
These tools are not replaced by anything in this chapter:
Your CRM (Salesforce, HubSpot, Pipedrive): The CRM is a system of record and a collaboration tool for your entire team. Nothing in this chapter replaces that, and nothing should. The CRM is the backbone. What we replaced is the constellation of point solutions that orbit around it.
Call recording (Gong, Chorus transcription): The recording and transcription functionality is genuinely valuable. What we replaced was the analytics layer, the pattern analysis you use a few times a year.
E-signature tools (DocuSign, HelloSign): The proposal generator handles document creation, not the signing ceremony.
Your dialer (Outreach, auto-dialers, email sequencing): These are workflow automation tools with deep integration into your communication stack. Different category entirely.
Sales training platforms (Lessonly, Mindtickle): They solve a different problem. Training and development is distinct from the operational tools we replaced.
The pipeline dashboard (Use Case 2), win/loss analysis (Use Case 8), and forecast (Use Case 10) require manual CSV exports from your CRM. You're trading "automatic but fragile" for "manual but reliable." For most mid-market sales teams doing weekly reporting, the export step is a non-issue. For teams needing real-time data, you'd want to add a CRM API connection, which moves these from intermediate builds to more technical ones.
The pipeline dashboard, client portal, and forecast app require occasional maintenance. Railway handles infrastructure, but feature changes mean opening Codex or Claude Code. This is faster than submitting a feature request to a SaaS company, but it requires a different mindset. You're the product owner of your own tools now.
Five of ten use cases are Beginner level. The Intermediate and Guided Technical use cases (pipeline dashboard, client portal, win/loss analysis, forecast) require comfort with GitHub and terminal commands. If nobody on the sales team has that, those may need help from IT or engineering for initial setup. Daily use afterward is straightforward.
The $2,700 in AI tool costs assumes sales is the only department using them. If marketing is already paying for Claude Max (as shown in Chapter 1), the incremental cost to sales drops to roughly $300/yr (just Railway hosting and the marginal ChatGPT Plus usage). Actual net savings could be north of $35,000 with shared tooling.
Prices cited reflect typical mid-market team configurations as of early 2026. Your actual costs may vary based on team size, deal volumes, and billing cycle. Check current pricing before making cancellation decisions.
Beyond the dollar savings, there's time coming back to your team. Proposal generation drops from 90 minutes to 10. Meeting prep goes from 45 minutes to 2. Pipeline reviews start with data everyone trusts instead of 15 minutes reconciling spreadsheets.
For a 10-person sales team, conservative estimates put the time savings at 8 to 12 hours per week across the team. That's one to one-and-a-half additional selling days every week. Over a year, that's 400 to 600 hours returned to the team. At an average fully loaded cost of $55/hour, the time savings alone are worth $22,000 to $33,000 annually, on top of the subscription savings.
The money matters. The time matters more. A sales team that spends 80% of its time selling instead of 60% doesn't just save on subscriptions. It closes more deals.
Priya's Sunday experiment didn't just save her company $36,800. It changed how her team thought about tools. The question stopped being "which SaaS product should we buy for this?" and became "can we build this ourselves in an afternoon?" Most of the time, the answer was yes.
She still has her CRM. She still records calls. She still uses DocuSign. But the twelve other subscriptions that used to surround those core tools? Gone. Replaced by a handful of AI agents that build exactly what her team needs, when they need it, without a sales cycle of their own.
The transition took six weeks. Not a weekend, not a quarter. Six weeks of methodical testing, one tool at a time, running old and new in parallel until the replacement proved itself.
That's the real shift. Not from expensive tools to cheap ones. From generic tools to specific ones. From software that your team adapts to, to tools that adapt to your team.
And the CFO stopped questioning the software spend. Not because the questions went away, but because the answers got a lot shorter. "We cancelled ten subscriptions and built replacements for less than $2,700 a year." Try getting that approved through a procurement cycle.